Scenario Analysis
October 15, 2024
Many companies are facing the consequences of extreme weather, such as storms, floods, droughts, and heatwaves. These physical climate risks manifest in additional electricity bills, business interruptions, labor shortages, water shortage, commodity prices, and delays across the supply chain. New climate stress testing and sustainability compliance standards, such as ESRS E1 and IFRS S2, both require climate scenario analysis. This new exercise involves quantifying the actual impact of climate risks on a company's activities. Each delay and interruption has a cost. What are these related costs, and how are they integrated into corporate risk management?
The first and foundational component of scenario analysis consists of identifying the assets and activities already at risk from severe weather events. Floods and droughts affect the balance sheet both directly and indirectly. Material damage is the direct impact. Water and power shortages are indirect impacts of floods that affect entire regions, far beyond the flooded area.
The second part of scenario analysis involves answering three key questions:
-
Where do we expect major climate anomalies? Which assets are at risk?
-
What kind of "last-minute surprises" should we be prepared for? Is it flooding, storms, or drought? Mitigation actions vary depending on the specific hazard.
-
Which facilities and investments require urgent action in the coming years? Given there isn’t an unlimited budget for climate-proofing, priorities should be clearly defined.
These questions require extensive data resources. You can’t gain much insight into rare and extreme events from a week of weather forecasts.
And that was the missing piece: the data resource providing exactly the type of data needed for climate stress testing and sustainability compliance. At Weather Trade Net, we made it happen!
First, we had to identify the meaningful part of the solution: defining the metric.
What could be an easy-to-use metric allowing comparisons
(a) across thousands of facilities,
(b) located worldwide,
(c) exposed to multiple types of hazards,
and
(d) across different forward-looking time horizons?
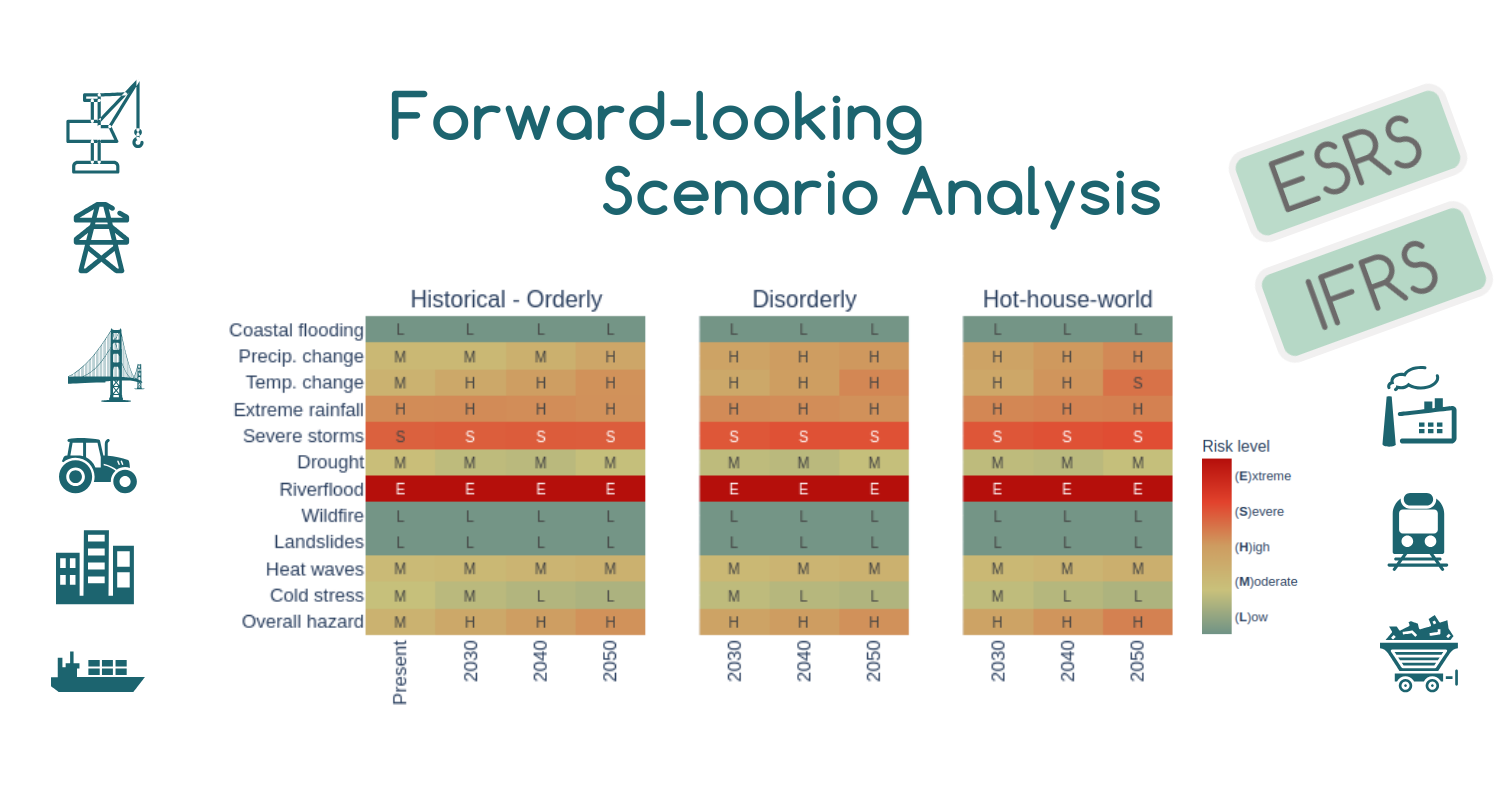
This example graph shows the heatmap. Each row corresponds to one climate hazard—both acute and chronic—including Coastal Flooding (sea level rise), Extreme Rainfall, and others.
The three blocks correspond to three scenarios: orderly (RCP2.6), disorderly (RCP4.5), and hot-house world (RCP8.5).
Columns in each block correspond to three time horizons: 2030, 2040, and 2050.
There is also a common historical reference risk score for all scenarios.
The “present day” risk score is calculated based on all historical data, representing the known exposure "as of today," based on observations.
Colors reflect the importance and amplitude of risks. The first and main focus for the risk manager should be on those locations and hazards where the risk is Severe or Extreme.
In this example, according to historical data, the primary three hazards that stand out are River Flood, Severe Storms, and Extreme Rainfall.
Good news: there is no Wildfire or Landslide risk for this facility.
Forward-looking scenario analysis for this location indicates a trend in four other hazards, with varying levels of intensity depending on the scenario. Both chronic hazards are amplified: precipitation and temperature pattern changes. This indicates that the volatility in precipitation and temperature regimes is not constant over time—the amplitude of year-to-year anomalies and averages is increasing. Acute hazards, such as Heatwave and Drought, also show an upward trend, though it is less pronounced.
Now that we know the “main focus” should be on Flood Risk, what does this mean?
An extreme risk score indicates that you need to zoom in! Essentially, a detailed flood analysis is necessary for this property with extreme risk. While the risk score reveals an issue near your facility, the map shows exactly how your location relates to the flood risk area:
-
Is your factory located within the flood area?
-
Or perhaps your factory is just outside the flood area, so there is no road access, and there is extensive damage to surrounding facilities?
-
Or maybe the flood area is one mile away from your factory, but it still has the potential to completely cut the main access road and cause water and power outages for several weeks.
Climate scenario analysis is the necessary exercise that helps to raise awareness. It’s useful for all companies that require water, electricity, food, and labour. Imagine if one of four components fails? Scenario analysis answers the question: “what if?”
The worst scenario is ignorance.